
Page 187 - Kỷ yếu hội thảo quốc tế: Ứng dụng công nghệ mới trong công trình xanh - lần thứ 9 (ATiGB 2024)
P. 187
178 TRƯỜNG ĐẠI HỌC SƯ PHẠM KỸ THUẬT - ĐẠI HỌC ĐÀ NẴNG
converts 12 V voltage to 25 kV to generate a spark, is Both air and fuel are supplied to the engine cylinder
integrated into the spark plug cap. To ensure the only during the intake stroke, and not continuously.
system's reliability during operation, the ignition coil Based on the amount of air and fuel per cycle, we can
is securely mounted on the engine bracket, and the calculate the average air flow rate V kk and the average
output of the ignition coil is connected to the spark fuel flow rate Vnl supplied to the cylinder at a given
plug through a high-voltage wire. The ignition coil is engine speed.
supplied with 12 V power. The control wire is
connected to the microcontroller's power-noise
suppression circuit.
Mass flow sensor installation: To determine the
initial appropriate injection amount, the fuel supplied
to the intake manifold is indirectly injected through a
containment bag. By observing the shape of the gas-
filled bag, we can determine whether the injected fuel
is excessive or insufficient. The gaseous fuel supplied
to the engine is opened and closed by a solenoid valve
to ensure safe operation.
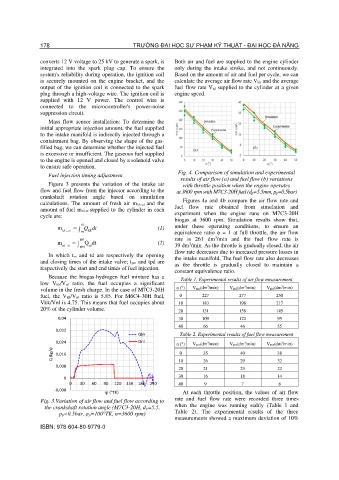
Fig. 4. Comparison of simulation and experimental
Fuel injection timing adjustment
results of air flow (a) and fuel flow (b) variations
Figure 3 presents the variation of the intake air with throttle position when the engine operates
flow and fuel flow from the injector according to the at 3600 rpm with M7C3-20H fuel (d p=5.5mm, p p=0.5bar)
crankshaft rotation angle based on simulation
calculations. The amount of fresh air m kk-ct and the Figures 4a and 4b compare the air flow rate and
amount of fuel m nl-ct supplied to the cylinder in each fuel flow rate obtained from simulation and
cycle are: experiment when the engine runs on M7C3-20H
biogas at 3600 rpm. Simulation results show that,
m = td Q dt (1) under these operating conditions, to ensure an
kk _ ct tm kk equivalence ratio ϕ = 1 at full throttle, the air flow
3
tpd rate is 261 dm /min and the fuel flow rate is
m = Q dt (2)
3
nl _ ct tpm nl 39 dm /min. As the throttle is gradually closed, the air
flow rate decreases due to increased pressure losses in
In which tm and td are respectively the opening the intake manifold. The fuel flow rate also decreases
and closing times of the intake valve; tpm and tpd are as the throttle is gradually closed to maintain a
respectively the start and end times of fuel injection.
constant equivalence ratio.
Because the biogas-hydrogen fuel mixture has a Table 1. Experimental results of air flow measurement
low Vkk/Vnl ratio, the fuel occupies a significant
3
3
3
volume in the fresh charge. In the case of M7C3-20H α () V kk1(dm /min) V kk2(dm /min) V kk3(dm /min)
fuel, the Vkk/Vnl ratio is 5.85. For M6C4-30H fuel, 0 227 277 250
Vkk/Vnl is 4.75. This means that fuel occupies about 10 183 198 217
20% of the cylinder volume. 20 131 158 145
0,04 30 109 122 95
40 66 46 55
0,032
Qkk Table 2. Experimental results of fuel flow measurement
0,024 Qnl 3 3 3
α () V kk1(dm /min) V kk2(dm /min) V kk3(dm /min)
Q (kg/s) 0,016 0 35 40 38
0,008 10 26 29 32
20 21 23 22
30 16 18 14
0
0 30 60 90 120 150 180 210 40 9 7 8
-0,008
(TK) At each throttle position, the values of air flow
Fig. 3.Variation of air flow and fuel flow according to rate and fuel flow rate were recorded three times
the crankshaft rotation angle (M7C3-20H, dp=5.5, when the engine was running stably (Table 1 and
pp=0.5bar, φp=100°TK, n=3600 rpm) Table 2). The experimental results of the three
measurements showed a maximum deviation of 10%
ISBN: 978-604-80-9779-0