
Page 188 - Kỷ yếu hội thảo quốc tế: Ứng dụng công nghệ mới trong công trình xanh - lần thứ 9 (ATiGB 2024)
P. 188
th
HỘI THẢO QUỐC TẾ ATiGB LẦN THỨ CHÍN - The 9 ATiGB 2024 179
compared to the average value. The deviation of the Therefore, to ensure that the actual equivalence
average experimental value of air flow rate and fuel ratio returns to the value of ϕ = 1, we need to adjust the
flow rate compared to the simulated value was less simulated injection duration based on experimental
than 5% (Figure 5 and Figure 6). The smaller average results. Figure 6 shows the adjusted injection duration
experimental value compared to the simulated value curve compared to the simulated injection duration
is due to the higher actual pressure loss in the intake curve. The absolute value of the injection duration
system than the calculated pressure loss in the adjustment is very small, so it can be considered as a
simulation. fine adjustment of the equivalence ratio.
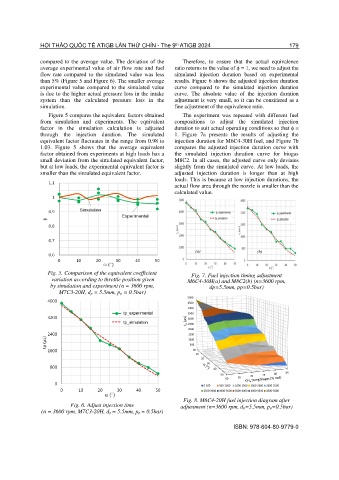
Figure 5 compares the equivalent factors obtained The experiment was repeated with different fuel
from simulation and experiments. The equivalent compositions to adjust the simulated injection
factor in the simulation calculation is adjusted duration to suit actual operating conditions so that ϕ =
through the injection duration. The simulated 1. Figure 7a presents the results of adjusting the
equivalent factor fluctuates in the range from 0.98 to injection duration for M6C4-30H fuel, and Figure 7b
1.03. Figure 5 shows that the average equivalent compares the adjusted injection duration curve with
factor obtained from experiments at high loads has a the simulated injection duration curve for biogas
small deviation from the simulated equivalent factor, M8C2. In all cases, the adjusted curve only deviates
but at low loads, the experimental equivalent factor is slightly from the simulated curve. At low loads, the
smaller than the simulated equivalent factor. adjusted injection duration is longer than at high
loads. This is because at low injection durations, the
actual flow area through the nozzle is smaller than the
calculated value.
Fig. 5. Comparison of the equivalent coefficient Fig. 7. Fuel injection timing adjustment
variation according to throttle position given M6C4-30H(a) and M8C2(b) (n=3600 rpm,
by simulation and experiment (n = 3600 rpm, dp=5.5mm, pp=0.5bar)
M7C3-20H, dp = 5.5mm, pp = 0.5bar)
5000
4500
4000
3500
t p (ms) 3000
2500
2000
1500
1000
500
00
10
20
30
40
50 70 75 80 85
60 65
0-500 500-1000 1000-1500 1500-2000 2000-2500
2500-3000 3000-3500 3500-4000 4000-4500 4500-5000
Fig. 8. M6C4-20H fuel injection diagram after
Fig. 6. Adjust injection time adjustment (n=3600 rpm, d p=5.5mm, pp=0.5bar)
(n = 3600 rpm, M7C3-20H, dp = 5.5mm, pp = 0.5bar)
ISBN: 978-604-80-9779-0