
Page 117 - Kỷ yếu hội thảo quốc tế: Ứng dụng công nghệ mới trong công trình xanh - lần thứ 9 (ATiGB 2024)
P. 117
108 TRƯỜNG ĐẠI HỌC SƯ PHẠM KỸ THUẬT - ĐẠI HỌC ĐÀ NẴNG
developing a UHD image processing embedded device. CALCULATION THE DETAILS
It is developed as an embedded device equipped with a FORMULA
GPU for edge-based defect detection and a R *P TP
R
communication function for transmitting a detection Score = i i *200 Recall ( ) = TP FN
+
i
i
image. At this time, it is developed integrally with the R + P TP
P
display so that it can be attached to the defect detection i i Precision i ( ) = TP+FP
i
instrument. It is possible to apply a lightweight AI
model that can perform real-time inspection with high-
resolution images from an embedded device. The Fig 7. Individual evaluation
Figure below shows examples of the design of the score calculation formula
embedded device main board and examples of the TP refers to the number of problems that match
configuration of the embedded device. the correct answer (number of true positives), FP
refers to the number of questions that output answers
that are not correct (number of false positives), and
FN refers to the number of questions that missed the
correct answer (number of false positives).
4. QUALITY MONITORING
For quality monitoring, we develop a quality
management integrated control solution system and
develop a GUI based on an integrated platform that
enables multi-channel on-site video linkage and
display, and detection event design and
implementation. Data management and classification,
automatic labeling and processing, semi-supervised
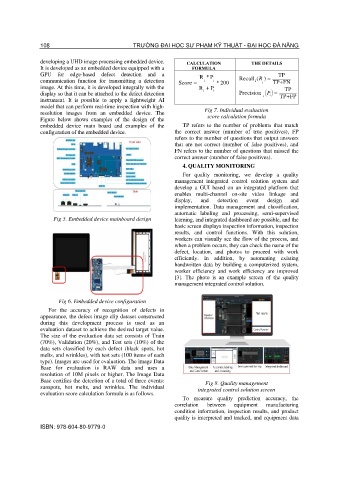
Fig 5. Embedded device mainboard design learning, and integrated dashboard are possible, and the
basic screen displays inspection information, inspection
results, and control functions. With this solution,
workers can visually see the flow of the process, and
when a problem occurs, they can check the name of the
defect, location, and photos to proceed with work
efficiently. In addition, by automating existing
handwritten data by building a computerized system,
worker efficiency and work efficiency are improved
[3]. The photo is an example screen of the quality
management integrated control solution.
Fig 6. Embedded device configuration
For the accuracy of recognition of defects in
appearance, the defect image clip dataset constructed
during this development process is used as an
evaluation dataset to achieve the desired target value.
The size of the evaluation data set consists of Train
(70%), Validation (20%), and Test sets (10%) of the
data sets classified by each defect (black spots, hot
melts, and wrinkles), with test sets (100 items of each
type). Images are used for evaluation. The image Data
Base for evaluation is RAW data and uses a
resolution of 10M pixels or higher. The Image Data
Base certifies the detection of a total of three events: Fig 8. Quality management
sunspots, hot melts, and wrinkles. The individual integrated control solution screen
evaluation score calculation formula is as follows.
To measure quality prediction accuracy, the
correlation between equipment manufacturing
condition information, inspection results, and product
quality is interpreted and tracked, and equipment data
ISBN: 978-604-80-9779-0