
Page 200 - Kỷ yếu hội thảo quốc tế: Ứng dụng công nghệ mới trong công trình xanh - lần thứ 9 (ATiGB 2024)
P. 200
th
HỘI THẢO QUỐC TẾ ATiGB LẦN THỨ CHÍN - The 9 ATiGB 2024 191
addition, we encountered decisions regarding hypothesized that the SN would impact PU through
categorizing the technologies analyzed in various internalization and the intention to apply the model
studies. In theory, we can categorize them into four through the compliance process. The depiction of our
distinct groups: specialized software applications outcome model can be shown in Figure 1.
(such as word processors and database programs),
Internet-related technology (including search engines
and transactional websites), microcomputers, and
communications technology (such as email and
mobile technology). The groups mentioned above
were additionally separated into microcomputers and
non-microcomputers.
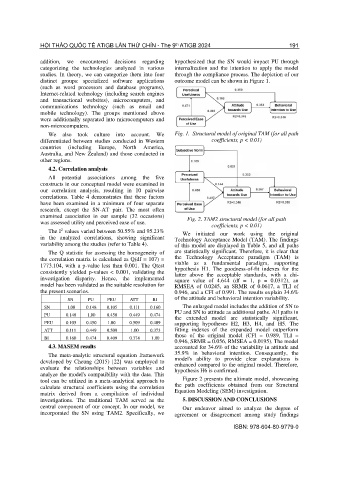
We also took culture into account. We Fig. 1. Structural model of original TAM (for all path
differentiated between studies conducted in Western coefficients, p < 0.01)
countries (including Europe, North America,
Australia, and New Zealand) and those conducted in
other regions.
4.2. Correlation analysis
All potential associations among the five
constructs in our conceptual model were examined in
our correlation analysis, resulting in 10 pairwise
correlations. Table 4 demonstrates that these factors
have been examined in a minimum of four separate
research, except the SN-AT pair. The most often
examined association in our sample (32 occasions) Fig. 2. TAM2 structural model (for all path
was assessed utility and perceived ease of use.
coefficients, p < 0.01)
2
The I values varied between 50.55% and 95.23% We initiated our work using the original
in the analyzed correlations, showing significant Technology Acceptance Model (TAM). The findings
variability among the studies (refer to Table 4). of this model are displayed in Table 5, and all paths
The Q statistic for assessing the homogeneity of are statistically significant. Therefore, it is clear that
the correlation matrix is calculated as Q(df = 107) = the Technology Acceptance paradigm (TAM) is
1773.104, with a p-value less than 0.001. The Qtest viable as a fundamental paradigm, supporting
consistently yielded p-values < 0.001, validating the hypothesis H1. The goodness-of-fit indexes for the
latter above the acceptable standards, with a chi-
investigation disparity. Hence, the implemented square value of 4.644 (df = 1, p = 0.0312), an
model has been validated as the suitable resolution for RMSEA of 0.0245, an SRMR of 0.0617, a TLI of
the present scenarios. 0.946, and a CFI of 0.991. The results explain 34.6%
SN PU PEU ATT BI of the attitude and behavioral intention variability.
SN 1.00 0.148 0.105 0.111 0.160 The enlarged model includes the addition of SN to
PU and SN to attitude as additional paths. All paths in
PU 0.148 1.00 0.450 0.449 0.474
the extended model are statistically significant,
PEU 0.105 0.450 1.00 0.509 0.409 supporting hypotheses H2, H3, H4, and H5. The
ATT 0.111 0.449 0.509 1.00 0.373 fitting indexes of the expanded model outperform
those of the original model (CFI = 0.989, TLI =
BI 0.160 0.474 0.409 0.374 1.00
0.946, SRMR = 0.056, RMSEA = 0.0195). The model
4.3. MASEM results accounted for 34.6% of the variability in attitude and
The meta-analytic structural equation framework 35.9% in behavioral intention. Consequently, the
developed by Cheung (2015) [22] was employed to model's ability to provide clear explanations is
enhanced compared to the original model. Therefore,
evaluate the relationships between variables and hypothesis H6 is confirmed.
analyze the model's compatibility with the data. This
tool can be utilized in a meta-analytical approach to Figure 2 presents the ultimate model, showcasing
calculate structural coefficients using the correlation the path coefficients obtained from our Structural
matrix derived from a compilation of individual Equation Modeling (SEM) investigation.
investigations. The traditional TAM served as the 5. DISCUSSION AND CONCLUSIONS
central component of our concept. In our model, we Our endeavor aimed to analyze the degree of
incorporated the SN using TAM2. Specifically, we agreement or disagreement among study findings
ISBN: 978-604-80-9779-0